

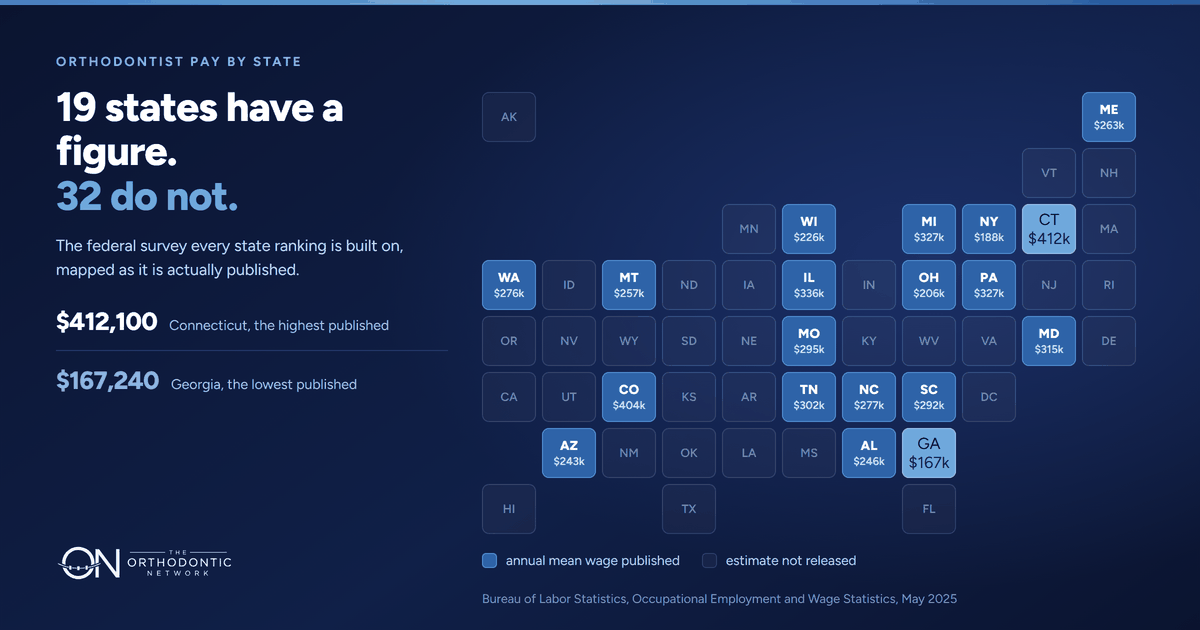
There is no published figure for what an orthodontist earns in California. None for Texas, Florida or New Jersey either, or for 28 other states.
Every state ranking online shows all 50.
The distance between those two sentences is worth closing before any ranking helps decide where a career starts.
Every state ranking traces back to one federal survey
The Occupational Employment and Wage Statistics program at the Bureau of Labor Statistics is the only source that measures orthodontist pay state by state. Its May 2025 figures put 6,210 orthodontists in employment nationally, at an annual mean wage of $259,400 and an annual median of $289,140.
The median sits above the mean, which is unusual and worth noticing before any of it is read as precise.
Every published ranking of orthodontist pay by state is built on this one series. The rankings differ in presentation, not in source.
The survey covers 19 states and withholds 32
Pulled directly from the agency for May 2025, an annual mean wage for orthodontists exists for 19 states. For the other 32 the agency returns a dash and the note "Estimate not released."
Among the states with no published figure: California, Texas, Florida, New Jersey, Massachusetts and Virginia.
Here is the whole published set, highest to lowest.
- Connecticut, $412,100
- Colorado, $404,120
- Illinois, $335,910
- Pennsylvania, $327,330
- Michigan, $327,310
- Maryland, $315,180
- Tennessee, $302,050
- Missouri, $295,460
- South Carolina, $292,350
- North Carolina, $277,320
- Washington, $276,250
- Maine, $263,020
- Montana, $257,230
- Alabama, $246,170
- Arizona, $242,650
- Wisconsin, $225,580
- Ohio, $206,430
- New York, $188,400
- Georgia, $167,240
A site showing all 50 states is showing something other than this. Where that something comes from is a fair question to ask of it.
The counts behind those figures are small
The agency publishes an employment count alongside the wage for some states. Washington 290, Ohio 250, Colorado 160, North Carolina 160, New York 130, Arizona 120, Wisconsin 90, Maine 60. Eleven of the 19 states with a published wage have no published count at all.
Set Connecticut at $412,100 beside New York at $188,400. Two states on the same coast, more than two to one apart, and the New York figure rests on 130 people.
Numbers built on samples that size move for reasons that have little to do with the state.
Cost of living explains some of the spread, and it is measurable
The Bureau of Economic Analysis publishes Regional Price Parities, which measure what a dollar buys in each state against a national average of 100. For 2024, released in February 2026, California sits at 110.7 and Arkansas at 86.9. Housing carries most of that: the rents index runs from 155.0 in the District of Columbia to 54.2 in West Virginia.
That is a gap of 23.8 index points, which works out to a dollar going about 27 percent further in Arkansas than in California. Real, and enough to close part of the distance between two states. Not enough to close a gap of two to one.
Practice owners are not in any of these numbers
The agency is direct about who it surveys. Its technical notes state: "The survey does not include the self-employed, owners and partners in unincorporated firms, household workers, or unpaid family workers."
That is what the 6,210 are: orthodontists on somebody's payroll. Everyone who owns their practice sits outside the count, by the survey's own rule rather than by accident.
For a resident, this is the useful part rather than a flaw. A first position is employment, so the figures describe that situation better than they describe anyone else's. What they cannot answer is what ownership pays in a given state, and no public source answers that.
Career stage moves pay further than geography does
The profession's own survey is the better guide to the shape of a career. The 2023 AAO Economics and Patient Census Study, reporting 2022 data, found roughly half of salaries below $300,000 and 14 percent below $150,000, with peak earners aged 45 to 54, of whom 29 percent earned more than $500,000.
It also found 71 percent of respondents under 35 reporting as employees, and those under 35 far more likely to be in a DSO or OSO setting, 28 percent against 12 percent of those 35 and older.
The distance between the start of a career and its middle is wider than the distance between any two states on the list.
What the state figures can settle, and what they cannot
They can tell a resident that published pay for employed orthodontists varies by more than two to one across the states where it is measured. That is worth knowing.
They cannot say what a particular offer in a particular state is worth, because the figure may not exist for that state, may rest on a sample of a hundred people, and excludes ownership entirely.
The number that settles an offer is not on any of these pages. It is the model in the contract, run against a quiet month and a busy one. What the national picture looks like across associate positions, DSOs and ownership is in our guide to what orthodontists earn in 2026.
How much did the state weigh when you chose where to start?
The future of orthodontics is connected.